The Hi-LO tool
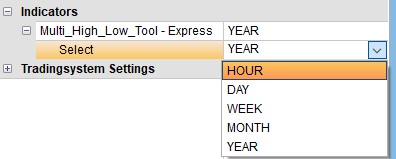
A simple yet fantastic idea. The trader chooses a period (hour, day, week, month...). The Hi-Lo tool then draws the highest and the lowest level in the chart.
The trader is not limited to one choice. It is, for example, possible to show both hourly and daily levels in the same chart.
These are the advantages of the Hi-Lo tool:
- The highs and lows are quickly visible.
- Multiple periods can be displayed in the same chart.
- The information is nicely integrated into the chart.
- Simple to understand and easy to apply.
- Suitable for all instruments.
- It is FREE
The lines are grey. They blend in nicely with the background of the chart. Precise labels indicate the traders’ choice.
Two trading examples
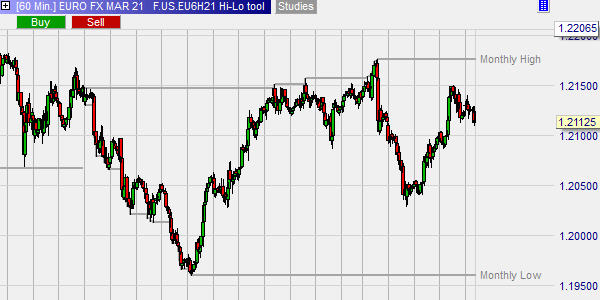
This example shows a 60-minute chart of the EUR/USD future. The trader shows the highest and the lowest price of the month.
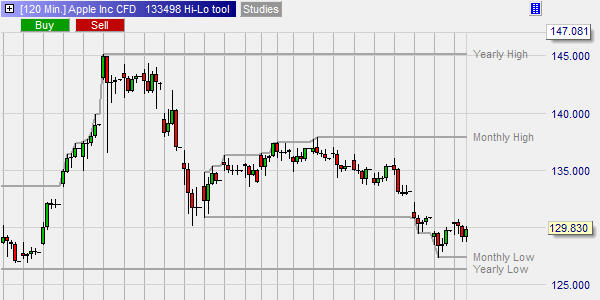
This example shows a 120-minute chart of the Apple stock. The trader shows the highest and the lowest prices of the year and of the month.
Practical implementation
- Open the chart of the instrument you wish to trade.
- In the WHS Proposals folder, select the study Hi-Lo.
- In the Designer Dialog, select one or more time frames.